

Written by: Justin Seltzer, MD (PGY-3) Edited by: Luke Neill, MD (PGY-4) Expert commentary by: Babak Jahromi, MD, PhD
According to the CDC, an ischemic stroke occurs approximately every 40 seconds in the US, with nearly 800,000 documented cases annually.[1] This, combined with an effective national stroke symptom public education program, has resulted in a large number of patients presenting to emergency departments for evaluation of stroke or stroke-like symptoms. Essential to this initial evaluation is neuroimaging, which in the emergency department is mainly CT based.
However, despite frequent use, many emergency physicians are not familiar enough with stroke imaging to interpret images on their own. A prior post addressed the basics of reading a complete head CT, which you can find here. The goal of this article is to discuss the indications and limitations as well as to provide a basic guide to interpretation of noncontrast CT imaging of the brain (NCCT), CT angiography (CTA) of the head and neck, and CT perfusion (CTP) imaging in acute stroke evaluation.
Acute stroke imaging is obtained in the emergency department for two purposes.
To evaluate rapidly for thrombolysis contraindications like hemorrhage and certain pathology such as vascular malformations and aneurysms. Thrombolysis has a high therapeutic benefit in stroke patients, with a number needed to treat of 10 within 3 hours of symptom onset and less than 20 if administered within 4.5 hours.[2,3] In addition, door to needle time of less than one hour is an established benchmark and quality measure.[3]
To identify a causative vascular lesion, which may or may not be amenable or contraindicatory to thrombolysis
Non-Contrast Head CT
NCCT is usually the first imaging modality obtained in the acute evaluation for stroke. Within the thrombolysis window (<4.5 hours), however, this scan is far more likely to detect hemorrhage than infarction. Chalela, et al., reviewed 356 patients evaluated for stroke symptoms at a single center over 18 months. They showed a sensitivity of 89% for detection of acute intracranial hemorrhage; conversely, the sensitivity for ischemic strokes less than 3 hours old was 12%, 16% for those older than 12 hours, and an overall sensitivity of 16%.[4] These findings are consistent with other studies and highlights the limitations of NCCT in acute stroke imaging.
Despite the poor sensitivity for acute infarction, there are a few ways to improve detection. Windowing adjustments can enhance grey-white matter differentiation, as loss of this in an area anatomically associated with the presenting deficit is suggestive of acute infarction. A window width and center of approximately 50 each achieves adequate grey-white differentiation (Figure 1). Additionally, asymmetric, hyperdense section of cerebral vasculature, known as the “dense vessel” sign, is also highly suggestive of middle cerebral artery (MCA) occlusion.[5] As a side note, IV contrast should not be used outside of angiography to “enhance” the image as it may extravasate into the ischemic parenchyma mimicking hemorrhage.[6]
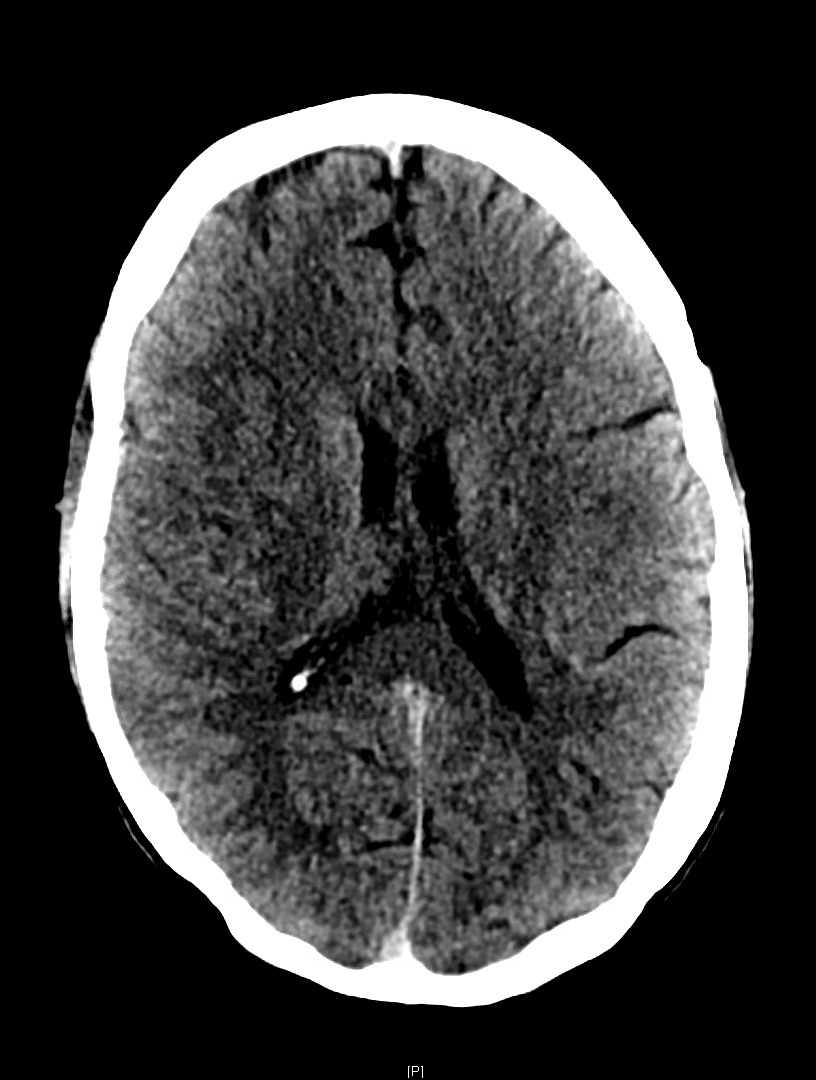
Figure 1. NCCT of the brain in an acute right M1 occlusion with a last known well time was approximately 13 hours before. Windowing set at C50/W50 for improved grey-white differentiation. Official read: “A diffuse asymmetric hypodensity and subtle loss of gray-white matter differentiation in the right frontal and parietal region is highly concerning for an acute right MCA stroke.”
CT Angiography of the Head and Neck
The role of CTA in acute stroke evaluation is to identify the culprit vascular lesion and is an excellent addition to the emergent evaluation of acute ischemic stroke. A 2014 pooled analysis of 21 studies from 1993 to 2013 showed CTA has a sensitivity of 83.2% and specificity of 95% with a 97.1% negative predictive value for greater than 50% cerebral vascular stenosis;[7] a 2017 pooled analysis of 7 studies from 2003 to 2012 broadly reported a sensitivity of 93% and specificity of 100% for acute ischemic stroke.[8] CTA of the neck is also obtained to evaluate the contributing cervical vasculature. Since interpretation of angiography is dependent on knowledge of the relevant anatomy, the key structures are reviewed below. If a more detailed review is desired or necessary, several neuroanatomy texts may be found in the references.
The major cerebral vasculature is supplied by the bilateral internal carotid arteries (ICA; “anterior circulation”) and the paired vertebral arteries (VA) that merge to form the basilar artery (BA; “posterior circulation”). The anterior circulation dominates perfusion of the cerebral hemispheres apart from the occipital lobe. The posterior circulation feeds the remaining structures, mainly the occipital lobe, cerebellum, and brain stem.

Figure 2. CTA of the neck showing bilateral patent CCAs and VAs.
Anterior circulation
The anterior circulation starts with the ICA, which branches from the common carotid artery (CCA) in the upper neck at around the level of the fourth cervical vertebra. (Figures 2, 3). The ICA has four parts with seven defined segments; in general, segments assist with lesion localization and are provided in parenthesis. The cervical part (cervical segment, C1) is first and enters the skull at the carotid foramen (Figure 5). It is distinguished from its companion external carotid artery by a lack of extracranial branching. Once in the skull, the petrous part (petrous segment, C2) traverses the carotid canal within the petrous portion of the temporal bone (Figure 5). Moving out of the temporal bone, the ICA then crosses into the cavernous sinus, where it is known as the cavernous part (lacerum segment, C3, cavernous segment, C4, clinoid segment, C5). Navigating the bony turns in this area results in a characteristic curvature known as the “carotid siphon” (Figure 6). From here, the vessel passes through the dura, where it becomes the cerebral or supraclinoid part (ophthalmic segment, C6, communicating segment, C7) and gives off the ophthalmic, posterior communicating, and anterior choroidal arteries; these posterior communicating arteries (PCommA) run to the ipsilateral posterior cerebral arteries (PCA), thus connecting the anterior and posterior circulations and forming part of the circle of Willis (Figure 7). At the terminus, the internal carotid arteries bifurcate into the bilateral anterior cerebral arteries (ACA) and MCAs. Acute ICA lesions can cause dramatic symptoms due to restricted blood flow to the ipsilateral ACA and MCA and are large vessel occlusions.[9-12]

Figure 3. CTA of the neck showing the bilateral carotid bifurcations. Artifact from metal in the patient’s teeth.

Figure 4. CTA of the neck showing patent bilateral ICAs as well the the bilateral VAs entering the foramen magnum
The ACAs run between the frontal hemispheres in the longitudinal fissure and supply a large portion of the medial cerebral structures such as the medial frontal and parietal lobes as well as the basal ganglia and parts of the internal capsule. They are smaller than the MCAs and their course is recurrent frontal-occipital and inferior-superior, which can make visualization in the axial plane difficult to appreciate. The paired arteries are connected by the anterior communicating artery (ACommA) early in their course which is the final connection completing the circle of Willis (Figure 7). Lesions within the A1 segment, which runs from the carotid terminus to the ACommA are considered large vessel occlusions though may be better tolerated due to collateral flow through the anterior communicating artery.[9,10,12]

Figure 5. CTA of the head showing the ICAs as they enter the skull and traverse the petrous portion of the temporal bone.

Figure 6. CTA of the head showing the ICA as it traverses the cavernous sinus; the carotid siphon is well visualized on the left.
The MCAs provide circulation to the remaining frontal and parietal lobes, basal ganglia, and internal capsules, as well as portions of the temporal lobes. They are larger and therefore more easily visualized than the ACAs (Figure 7). A lesion of the M1 segment, which runs from the carotid terminus to the bifurcation into the M2 segments, is considered a large vessel occlusion (Figures 8, 9).[9,10,12]

Figure 7. CTA of the head showing an intact circle of Willis

Figure 8. CTA of the head showing an acute right M1 occlusion in the axial plane

Figure 9. Coronal MIPS of the same vascular occlusion noted in Figure 8 with clear deficit on the right compared with the left.
Posterior circulation
The posterior circulation starts with the VAs, which are subclavian branches that traverse the cervical spine via transverse foramina (Figures 2, 3). Prior to joining, each vertebral artery gives off an ipsilateral posterior inferior cerebellar arteries (PICA) as well as the contributing vessels that form the anterior and posterior spinal arteries. Upon entering the skull via the foramen magnum, the bilateral vertebral arteries join to form the basilar artery at about the level of the medullo-pontine junction (Figures 4, 5, 6). As the basilar artery moves superiorly it gives off the bilateral anterior inferior cerebellar arteries (AICA), multiple bilateral small perforating pontine arteries, the bilateral superior cerebellar arteries, and then finally terminates with a bifurcation into the bilateral posterior cerebral arteries (PCA). As noted prior, these PCAs connect with the ipsilateral posterior communicating arteries from the anterior circulation (Figure 7). Vertebral, basilar, and early posterior cerebral artery occlusions are considered large vessel occlusions but there is, as of now, limited data on mechanical thrombectomy in these territories.[9,10,12,13]
Application
Reading the scan itself is fairly straightforward based on the vascular anatomy. We recommend starting caudally (usually the aortic arch) in the axial plane and tracing all four cervical vessels cranially until they form the circle of Willis and from there extend out into the major branches. The coronal plane is particularly useful for evaluation of the anterior cervical vessels and the MCAs. Significant asymmetry or loss of contrast opacification in vascular beds anatomically consistent with the presenting symptoms should be considered strokes until proven otherwise. Make note of vascular abnormalities such as significant carotid stenosis, aneurysms, and malformations.
Additional 2-D and 3-D post-processing images may also be provided. The most common is maximum intensity projection (MIP), which highlights high density structures over low density; this allows for improved visualization of the contrast enhanced vasculature at the expense of the surrounding brain tissue. However, MIP images can be falsely negative and should not be used alone for primary vascular evaluation.[14]
CT Perfusion
Though less common than CTA, CTP may also be acquired in the emergency setting to evaluate for territorial changes in cerebral blood flow suggestive of stroke. It is particularly valuable for identifying core infarct and salvageable ischemic penumbra and is becoming an important part of interventional decision making. It has a similar sensitivity and specificity for acute ischemic stroke as CTA, its use has been validated in multiple interventional stroke studies, and it has been shown to predict core infarct size accurately compared to the gold standard MRI.[7,8,15]
Basic concepts
While the specifics of CTP are complex and beyond the scope of this article, there are a few important concepts. CTP operates under the “central volume principle,” which is represented by the equation CBF = CBV/MTT and defines the relationship between cerebral blood volume (CBV; volume of flowing blood in a set volume of brain tissue), blood flow (CBF; per time unit rate of flowing blood in a set volume of brain tissue), and mean transit time (MTT; average time for blood to transit a set volume of brain tissue). To illustrate this concept, imagine an acute arterial occlusion. The obstruction causes an immediate increase in MTT due to slowed arterial flow through the affected tissue. To maintain CBF a local compensatory vasodilation occurs, increasing CBV. However, this vasodilation may not be able to compensate for rising MTT, causing a progressively inadequate CBF that may result in infarction.[5,16]
Algorithms translate detected changes in MTT, CBV, and CBF into images that can be used in clinical decision-making. MTT is obtained by measuring the movement of contrast through the affected tissue; this also gives a value known as Tmax, which is the time to achieve peak contrast density. CBV and CBF are calculated relative values (rCBF, rCBV) and based off of the surrounding normal tissue. Composite metrics, such as mismatch ratio, the ratio of penumbra to the core infarct volumes, and mismatch volume, the penumbra volume minus the core infarct volume, are also generated.[11] Though there is no set rule, there is evidence that thrombolysis benefit is maximized and hemorrhage risk minimized with a mismatch ratio of 1.8 or greater, a mismatch volume of 15ml or greater, and a core infarct volume less than 70ml.[17]

Figure 10. Illustrative CTP report for the same acute right M1 occlusion from Figures 8 and 9 showing the core infarct (purple) and associated penumbra (green). Note the large mismatch volume and ratio, indicating a relatively small core infarct relative to the threatened penumbra.
Application
These values are then made into “parametric maps” superimposed onto axial CT slices, allowing for visual identification (Figures 10, 11). Different software may present the values and parametric maps differently; note that our institution uses RAPID (iSchemaView, Menlo Park, CA) and our example figures were generated by this software. Using Figure 10 as an example, we see purple and green areas as well as different volumes and ratios. The purple area corresponds to the volume of tissue with a rCBF less than 30% of the unaffected, healthy tissue and is considered the core infarct area. The green area corresponds to the volume of tissue with a Tmax longer than six seconds and is considered the ischemic penumbra. Though these threshold values were used and validated by the SWIFT PRIME and EXTEND-IA trials, they are not definitive or universal.[15,18] Familiarization with an institution’s software and threshold values is vital to interpreting CTP properly.
Importantly, CTP can be abnormal in other situations such as with chronic infarcts, vasospasm from subarachnoid hemorrhage, microvascular ischemia, and cerebral changes associated with seizure and feeding vessel stenosis.[16] Always interpret CTP in the context of the other imaging findings and anatomic consistency.

Figure 11. Illustrative CTP report for the same acute right M1 occlusion from Figured 8, 9, and 10 showing territorially increased MTT with subtle reduction in CBF and a small area of asymmetrically elevated CBV in the area corresponding to infarction in Figure 10. This figure visually highlights the relationships between rCBV, cCBF, MTT, and Tmax.
Take Away Points
CT is the primary source of neuroimaging in the emergency department evaluation of stroke patients. NCCT is poor at detecting early acute infarcts directly, however it is excellent for hemorrhage detection. Use of CTA can demonstrate causative vascular lesions and addition of CTP can further delineate ischemia and determine how amenable it might be to intervention. Not all lesions identified by CTA and CTP will be amenable to thrombolysis or thrombectomy, but these are usually the only time effective ways available to emergency physicians to identify those that might be. Educating emergency physicians about these imaging modalities can both improve patient care through more rapid diagnosis in suspected stroke cases as well as help to streamline communication and treatment planning with consulting neurologists and neurointerventionalists.
Expert Commentary
This is a well-written synopsis of modern neuroimaging used today’s ED for workup and emergent treatment of acute stroke. The reader should keep in mind that the primary thrust of this blog segment is on acute ischemic stroke - while advanced CT imaging (i.e. CTA) also has a crucial role in hemorrhagic stroke, this is more thoroughly addressed elsewhere.
Practically speaking, today’s CT/CTP/CTA is to suspected stroke what an EKG is to chest pain in the ED. While confirmatory tests (MRI for stroke, troponin for MI) take more time, all actionable data depends on the initial CT/CTP/CTA in acute stroke. I would also categorize the purpose of acute stroke imaging in the ED into two categories, but with perhaps broader brush-strokes:
Determine if stroke is ischemic or hemorrhagic (“blood or no blood on CT”), and
Determine the next course of action:
If ischemic, do temporal and anatomic criteria mandate IV tPA, endovascular thrombectomy, both, or neither,
If hemorrhagic, is there mass effect and/or an underlying vascular lesion (arterial or venous) that mandates urgent intervention beyond best medical care.
While NCCT is sufficient to determine whether to proceed with IV tPA in the 0-4.5 hour time-window (with an NNT of 10-20), CTP/CTA are key to determining whether the patient requires emergent endovascular thrombectomy in the 0-24 hour time-window (with an NNT of 2.6-4). As these two time-windows overlap, the most practical approach is increasingly to obtain multi-modality imaging up-front / as rapidly as possible in the ED. It is important to remember that as of 2015, both IV tPA and endovascular thrombectomy are considered standard-of-care, and any patient presenting with acute ischemic stroke must undergo full workup and consideration of both treatments based upon national society / consensus guidelines.
An added note on NCCT versus CTP: while NCCT is the oldest modality in the ED, it continues to have tremendous value in acute stroke imaging. Presence or absence of early stroke changes on NCCT (quantified by the ASPECT score) can at times trump CTP in the 0-6 hr time-window, and CTP within any time-window must be interpreted in context of NCCT findings. For example, CTP may show no abnormality (or even luxury perfusion) in an area of established stroke on NCCT in cases of spontaneous recanalization. On the other hand, CTP can be very helpful in detecting small areas of ischemia not well seen on CT/CTA (even when reading NCCT using optimized 35/35 or 40/40 “stroke windows”), and CTP has higher sensitivity for small/distal branch occlusions than either CT/CTA.
The approach to cerebrovascular arterial anatomy is nicely reviewed. A few additional comments:
ICA: acute ICA occlusions are most dramatic when reaching the terminus (thereby blocking the MCA/ACA), but those not reaching the supraclinoid ICA may at times be well-tolerated due to collaterals across the Circle of Willis,
VA: the course/anatomy of the VA is rather variable, with one VA (typically the right) being less dominant as we age; similarly, PICA can have a variable origin and territory of supply, and
BA: while randomized trials of endovascular thrombectomy for basilar occlusion have not been published, the natural history of BA occlusion is typically devastating/fatal, and a large body of non-randomized data (case series/cohorts) shows marked improvement over this natural history following endovascular thrombectomy for BA stroke in selected patients.

Vice Chair of Regional Neurosurgery
Professor of Neurological Surgery
Department of Neurological Surgery
Feinberg School of Medicine
How to Cite this Post
[Peer-Reviewed, Web Publication] Seltzer J, Neill L. (2020, Jan 6). Emergency Guide to Stroke Neuroimaging. [NUEM Blog. Expert Commentary by Jahromi B]. Retrieved from http://www.nuemblog.com/blog/2018/4/20/stroke-neuroimaging
References
National Center for Chronic Disease Prevention and Health Promotion , Division for Heart Disease and Stroke Prevention. “Stroke Fact Sheet.” Last Update: September 1, 2017. Accessed from https://www.cdc.gov/dhdsp/data_statistics/fact_sheets/fs_stroke.htm
Emberson J, Lees KR, Lyden P, et al., for the Stroke Thrombolysis Trialists’ Collaborative Group. Effect of treatment delay, age, and stroke severity on the effects of intravenous thrombolysis with alteplase for acute ischaemic stroke: a meta-analysis of individual patient data from randomised trials. Lancet. 2014 Nov 29;384(9958):1929-35.
Filho JO, Samuels OB. Approach to reperfusion therapy for acute ischemic stroke. UpToDate. Last Update: September 14, 2018. Accessed from https://www.uptodate.com/contents/approach-to-reperfusion-therapy-for-acute-ischemic-stroke
Chaela JA, Kidwell CS, Nentwich LM, et al.. Magnetic resonance imaging and computed tomography in emergency assessment of patients with suspected acute stroke: a prospective comparison. Lancet. 2007 Jan 27; 369(9558): 293–298.
Nadgir R, Yousef DM. “Vascular Diseases of the Brain.” In Neuroradiology: The requisites. 4th Ed. (2017). Philadelphia, PA: Mosby/Elsevier
Yoon W, Seo JJ, Kim JK, Cho KH, Park JG, Kang HK. Contrast enhancement and contrast extravasation on computed tomography after intra-arterial thrombolysis in patients with acute ischemic stroke. Stroke. 2004 Apr;35(4):876-81.
Sabarudin A, Subramaniam C, Sun Z. Cerebral CT angiography and CT perfusion in acute stroke detection: a systematic review of diagnostic value. Quant Imaging Med Surg. 2014 Aug;4(4):282-90.
Shen J, Li X, Li Y, Wu B. Comparative accuracy of CT perfusion in diagnosing acute ischemic stroke: A systematic review of 27 trials. PLoS One. 2017 May 17;12(5):e0176622.
Mancall EL. “Vascular Supply of the Brain and Spinal Cord” In Gray's clinical neuroanatomy: The anatomic basis for clinical neuroscience. 1st Ed. (2011). Philadelphia, PA: Elsevier/Saunders.
Mtui E, Gruener G, Dockery P. “Blood Supply of the Brain.” In Fitzgerald’s Clinical Neuroanatomy and Neuroscience. 7th Ed. (2016). Edinburgh: Elsevier Saunders.
Bouthillier A, van Loveren HR, Keller JT. Segments of the internal carotid artery: a new classification. Neurosurgery. 1996 Mar;38(3):425-32.
The Joint Commission. Specifications Manual for Joint Commission National Quality Measures (v2018B). Last Updated: 2018. Accessed from https://manual.jointcommission.org/releases/TJC2018B/DataElem0771.html
Filho JO, Samuels OB. Mechanical thrombectomy for acute ischemic stroke. UpToDate. Last Update: March 22 2019. Accessed from https://www.uptodate.com/contents/mechanical-thrombectomy-for-acute-ischemic-stroke
Prokop M1, Shin HO, Schanz A, Schaefer-Prokop CM. Use of maximum intensity projections in CT angiography: a basic review. Radiographics. 1997 Mar-Apr;17(2):433-51.
Mokin M, Levy EI, Saver JL, Siddiqui AH, Goyal M, Bonafé A, Cognard C, Jahan R, Albers GW; SWIFT PRIME Investigators. Predictive Value of RAPID Assessed Perfusion Thresholds on Final Infarct Volume in SWIFT PRIME (Solitaire With the Intention for Thrombectomy as Primary Endovascular Treatment). Stroke. 2017 Apr;48(4):932-938.
Lui YW, Tang ER, Allmendinger AM, Spektor V. Evaluation of CT perfusion in the setting of cerebral ischemia: patterns and pitfalls. AJNR Am J Neuroradiol. 2010 Oct;31(9):1552-63.
Bivard A, Levi C, Krishnamurthy V, McElduff P, Miteff F, Spratt NJ, Bateman G, et al.. Perfusion computed tomography to assist decision making for stroke thrombolysis. Brain. 2015 Jul;138(Pt 7):1919-31.
Campbell BC, Mitchell PJ, Kleinig TJ, Dewey HM, Churilov L, Yassi N, Yan B,et al.; EXTEND-IA Investigators. Endovascular therapy for ischemic stroke with perfusion-imaging selection. N Engl J Med. 2015 Mar 12;372(11):1009-18.


Guidance on the use of CT imaging in pediatric patients with head trauma