

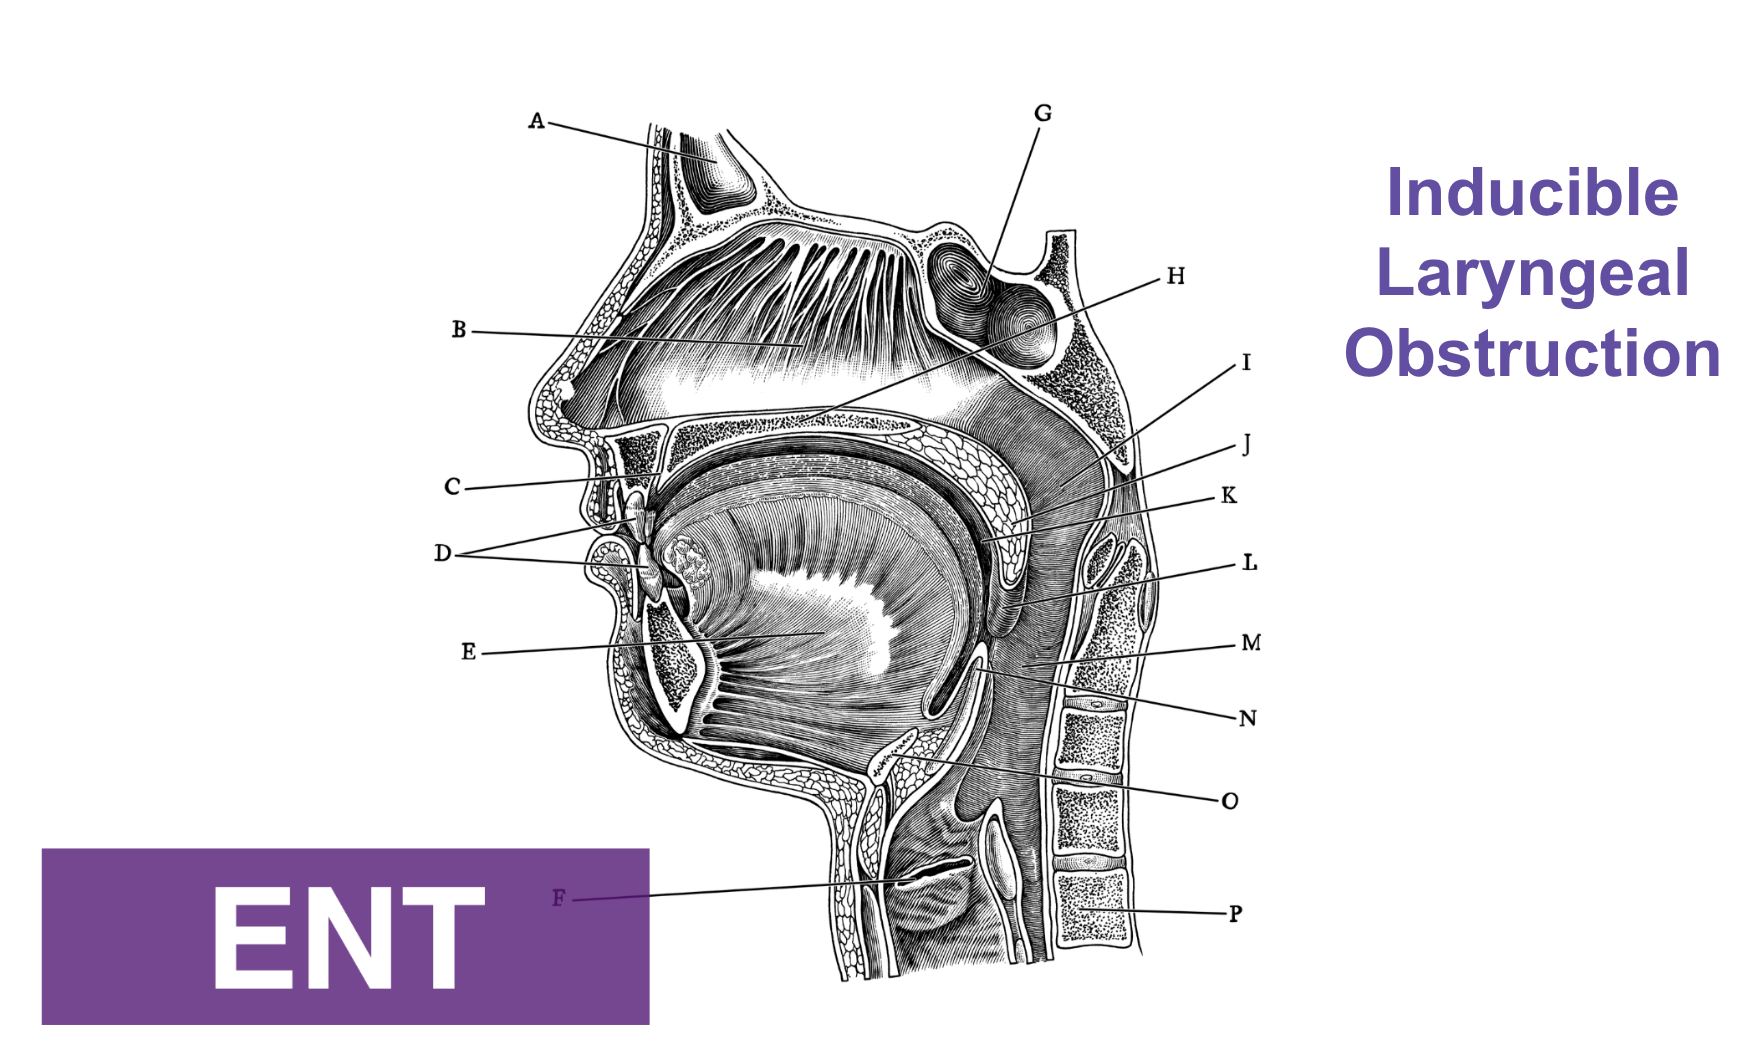
Overview and management of inducible laryngeal obstruction
Posts tagged #Pulmonary
Proning for ARDS
A review of proning in patients with ARDS
Crashing Patient on a Ventilator
Written by: Patrick King, MD (NUEM ‘23) Edited by: Adesuwa Akehtuamhen, MD (NUEM ‘21)
Expert Commentary by: Matt McCauley, MD (NUEM ‘21)
Expert Commentary
Thank you for this succinct summary of an incredibly important topic. We as emergency physicians spend a lot of time thinking about peri-intubation physiology but the challenges do not end once the plastic is through the cords. The frequency with which our ventilated patients stay with us in the ED has been increasing for years and will likely continue to do so1. This means that managing both acute decompensation and refractory hypoxemia needs to be in our wheelhouse.
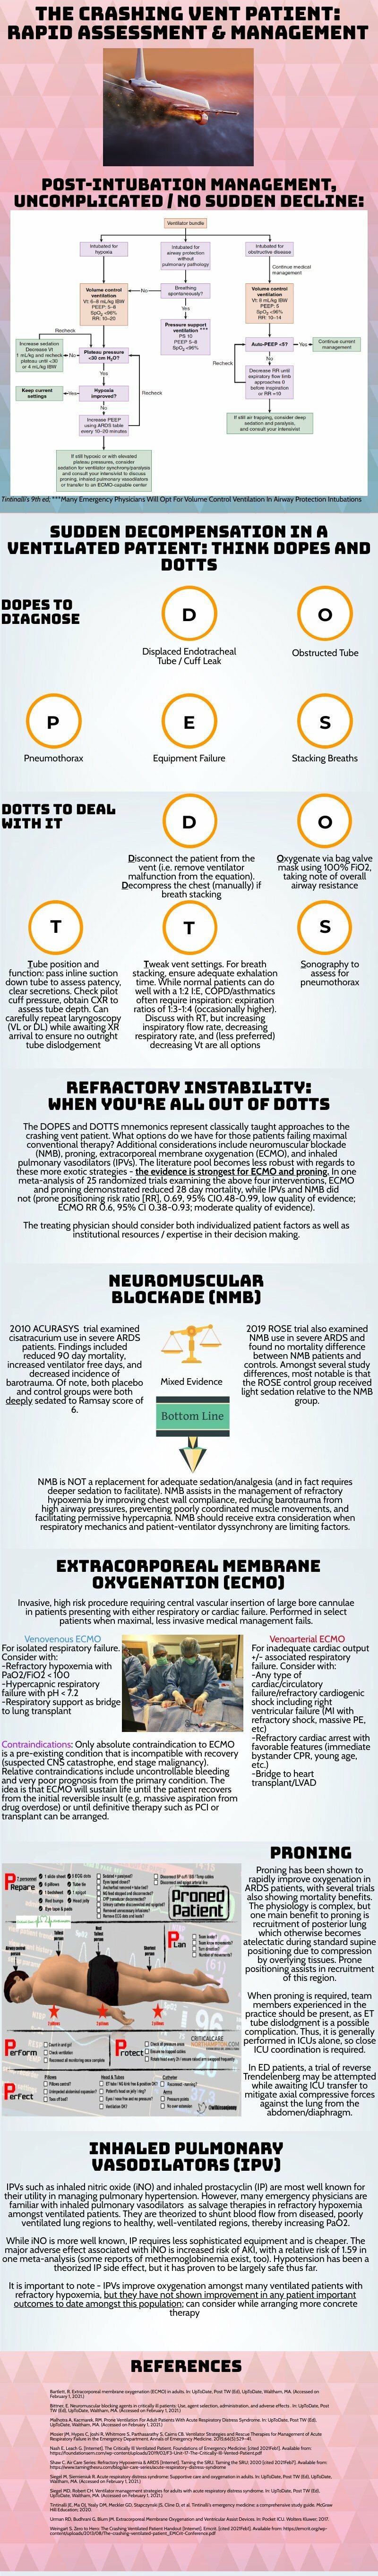
The crashing patient on the ventilator can be truly frightening and your post effectively outlines a classic cognitive forcing strategy for managing these emergencies. A truism in resuscitation is to always rule out the easily correctable causes immediately. In this case, it means removing the complexity of the ventilator and making things as idiot-proof as possible. Once you’ve ruled out the life threats like pneumothorax, tube displacement, and vent malfunction, you can try to bring their sats up by bagging. Just make sure that you have an appropriately adjusted PEEP valve attached to your BVM for your ARDS patients; the patient who was just requiring a PEEP of 15 isn’t going to improve with you bagging away with a PEEP of 5.
Once you’ve gotten the sats up and the patient back on the vent, your ventilator display can provide you with further data as to why your patient decompensated. Does the flow waveform fail to reach zero suggesting breath stacking and a need for a prolonged expiratory time? Is the measured respiratory rate much higher than your set rate with multiple breaths in a row indicating double-triggering? The measured tidal volume might fall short of your set tidal volume. This points towards a circuit leak, cuff leak, or broncho-pleural fistula. Maybe you’re seeing the pressure wave dip below zero mid-inspiration and the patient is telling you that they are in need of faster flow, a bigger breath, or deeper sedation. In these situations, your respiratory therapist is going to be your best friend in managing this patient-ventilator interactions2.
As your post alludes to, sometimes patients remain hypoxemic despite our usual efforts and refractory hypoxemia can be an intimidating beast when you’ve got a busy ED burning down around you. If your cursory efforts to maintain vent synchrony by playing with the ventilator dials have failed, there’s no shame in deepening sedation which will work to decrease oxygen consumption and prevent derecruitment. Once sedated, work with your RT to find appropriate PEEP and tidal volumes to meet your goals.
Most patients can be managed with usual lung-protective ventilation but some patients will require more support and you’ve correctly identified several salvage therapies. My general approach is to pursue prone positioning in any patient with a P:F ratio approaching 150 despite optimal vent settings as it has the only strong mortality benefit of the therapies outlined above. Proning in the ED is resource intensive and is probably better pursued as a department-wide protocol rather than you and your charge nurse trying to figure it out in the middle of the night3.
As you’ve pointed out, the neuromuscular blockade has more limited evidence and is not required for prone ventilation. Upstairs, we accomplish this with continuous infusions but in the ED you may be more comfortable using intermittent boluses of intubation dose rocuronium. Just make sure your patient is unarousable. I reach for this if I’m unable to achieve ventilator synchrony with sedation alone as it allows for very low tidal volumes and inverse ratio ventilation. I see inhaled pulmonary vasodilators in a similar light: there’s no data on patient-oriented outcomes but they can make your numbers look prettier while you wait for more definitive interventions such as transfer.
This finally brings me to VV ECMO for refractory hypoxemia. It’s worth considering that while there is some evidence for a mortality benefit for ECMO in ARDS, the evidence base is mixed. The CESAR trial did show a mortality benefit in patients transferred to an ECMO center but only 76% of patients actually received ECMO upon transfer4. The larger and more recent EOLIA trial failed to demonstrate this improvement in mortality5. The conclusion I take from this is that treatment at a high volume center matters and that a boarding patient with refractory hypoxemia warrants an early consideration for transfer to a tertiary center if high-quality ARDS care can’t be accomplished upstairs at your shop.
References
Mohr NM, Wessman BT, Bassin B, et al. Boarding of Critically Ill Patients in the Emergency Department. Crit Care Med. 2020;48(8):1180-1187. doi:10.1097/CCM.0000000000004385
Sottile PD, Albers D, Smith BJ, Moss MM. Ventilator dyssynchrony – Detection, pathophysiology, and clinical relevance: A Narrative review. Ann Thorac Med. 2020;15(4):190. doi:10.4103/atm.ATM_63_20
McGurk K, Riveros T, Johnson N, Dyer S. A primer on proning in the emergency department. J Am Coll Emerg Physicians Open. 2020;1(6):1703-1708. doi:10.1002/emp2.12175
Peek GJ, Mugford M, Tiruvoipati R, et al. Efficacy and economic assessment of conventional ventilatory support versus extracorporeal membrane oxygenation for severe adult respiratory failure (CESAR): a multicentre randomised controlled trial. Lancet Lond Engl. 2009;374(9698):1351-1363. doi:10.1016/S0140-6736(09)61069-2
Combes A, Hajage D, Capellier G, et al. Extracorporeal Membrane Oxygenation for Severe Acute Respiratory Distress Syndrome. N Engl J Med. Published online May 23, 2018. doi:10.1056/NEJMoa1800385

Matt McCauley, MD
How To Cite This Post:
[Peer-Reviewed, Web Publication] King, P. Akehtuamhen, A. (2022, Feb 28). Crashing Ventilator Patient. [NUEM Blog. Expert Commentary by McCauley, M]. Retrieved from http://www.nuemblog.com/blog/crashing -vent-patient.
Other Posts You May Enjoy


Mechanical Ventilation Oversimplified
Written by: Shawn Luo, MD (NUEM ‘22) Edited by: Sam Stark, MD, MA (NUEM ‘20)
Expert Commentary by: Ruben Mylvaganam, MD
The ventilator: we’ve all learned about it - the lectures, the bed-side demonstrations on those mind-numbingly long ICU rounds. But we were also told, repeatedly, “Don’t touch it!” Unless you are an attending, fellow, or respiratory therapist (RT) of course. So for a lot of us, the ventilator is a black box, mythical and intimidating.
In this blog, I hope to demystify ventilators a little so when duty calls, you can set initial settings and make some basic adjustments.
Physiology
1. How Mechanical Ventilation affects Oxygenation: PEEP & FiO2
You can reference this nice ARDSnet table for FiO2/PEEP combinations.

FiO2 – its effect is immediate
PEEP – takes up to an hour to show full effect
Therefore, when weaning, wean FiO2 before weaning PEEP so that if the patient desaturates, you have room to go up on FiO2.
2. How Mechanical Ventilation affects Ventilation: Tidal Volume, Respiratory Rate, Inspiratory Pressure or Inspiratory Time
This should be titrated in response to the patient's CO2 levels. Patients in respiratory failure from profound metabolic acidosis will need you to set higher minute ventilation to attempt respiratory compensation.
3. Peak Pressure and Plateau Pressure
Peak pressure is the summation of both airway resistance (dynamic compliance) and plateau pressure (static compliance). Most modern ventilators will automatically report peak pressures without any special maneuvers required. When thinking about airway resistance, think of when you blow air through a straw – the narrower the tubing the higher the resistance and thus a lot of pressure is needed to generate that flow. To measure airway resistance, have the RT set the flow rate to 60 LPM, adjust the flow pattern to a square wave form, and ask them to perform an inspiratory hold.
Plateau pressure is related to lung compliance (higher plateau pressure = less compliant lung). It is the pressure “felt” by the alveoli, and keeping it less than 30 cm H2O helps to prevent barotrauma. It’s only measured after the air stops moving (via an inspiratory hold maneuver – ask RT how to do this on your ventilator) so that dynamic airway resistance is not a factor.
4. Breath-stacking / Auto-PEEP
This occurs when the patient does not have enough time to finish exhalation before the next breath is delivered. This results in progressive hyperinflation of the lung, high peak pressures, and eventually hemodynamic collapse if not identified and intervened upon. It is most common in obstructive airway diseases such as asthma and COPD. Be vigilant for the flow diagram below on the ventilator to detect it early.

Modes
Volume vs Pressure – WHAT TYPE of breath is targeted
Volume mode means the vent will deliver a set tidal volume of air and results in whatever pressure (i.e. stiffer lungs result in higher pressure)
Pressure mode in turn means the vent will deliver at a set inspiratory pressure, and results in whatever volume (i.e. stiffer lungs result in lower volume)
A/C (Assist/Control) vs Support – WHEN the breath is delivered
In A/C mode, the machine delivers breath at a pre-set frequency (control), but the patient can also trigger additional breaths (assist) to faster than the set frequency. A quick and dirty trick is that any mode that contains the word “Control” means there will be a minimal respiratory rate set by the clinician.
Support (or Spontaneous) mode, in turn, will only deliver a breath when the patient initiates it. It senses the negative pressure generated by the patient and delivers a breath. If the patient does not breathe, it will not deliver. Usually safety back-up is in place to prevent prolonged apnea.

Volume Control
Delivers set tidal volume at or above a set rate
You set: tidal volume (6-8mL/kg ideal body weight), respiratory rate (16-22 breaths per minute), flow rate (60-80 LPM), and PEEP & FiO2 as needed
Check: Plateau pressure <30 (inspiratory hold maneuver)
This is a good initial setting for most of the patients you just intubated
Pressure Control
Delivers set pressure at or above set rate
You set: inspiratory pressure (5-15 cm H2O), inspiratory time (“I-time”; 0.6-0.8), respiratory rate (16-22), PEEP & FiO2 as needed
Check: to make sure the patient is getting tidal volumes of 6-8 mL/kg
This can be a helpful setting in some patients that do not tolerate volume control. Adjust pressure support to achieve tidal volume of 6-8 mL/kg while ensuring total pressure is less than 30-35 cm H20.
Pressure Support
Delivers set pressure when the patient initiates a breath to help the patient move the air
You set: Pressure support (5-15 cm H2O), PEEP & FiO2 as needed
Check: to make sure the patient is getting tidal volumes of 6-8 mL/kg
Usually a weaning mode to check if the patient is likely to tolerate extubation
*The bottom line is, by adjusting the parameters, you can achieve the same result with different ventilation modes.
My step-wise approach to initiate mechanical ventilation on most patients:
Build initial settings around Volume Control (tidal volume 6-8mL/kg ideal body weight, respiratory rate 16-22, PEEP 5, FiO2 100%)
Tweak according to patient’s clinical scenario – e.g. higher respiratory rate for acidotic patients, higher initial PEEP for hypoxemic respiratory failure, longer expiratory time for asthmatics/COPD patients with auto-PEEP
Start mechanical ventilation, quickly wean FiO2 for a goal SpO2 of 94-98%
Adjust settings further based on clinical response and ABGs
When in doubt, disconnect and bag the patient.
References:
The Acute Respiratory Distress Syndrome Network. Ventilation with lower tidal volumes as compared with traditional tidal volumes for acute lung injury and the acute respiratory distress syndrome. N Engl J Med. 2000;342:1301-1308.
Weingart, S. Managing Initial Mechanical Ventilation in the Emergency Department. Annals of Emergency Medicine, Volume 68, Issue 5, November 2016, Pg 614-617
Hyzy, R. Modes of Mechanical Ventilation. In: UpToDate, Parsons P. Finlay G (Ed), UpToDate, Waltham, MA. (Accessed on May 5, 2020.)
Expert Commentary
Thank you for the opportunity to review this very helpful and concise review on the basics of invasive mechanical ventilation. I hope to make this commentary brief, a contrast to our notoriously long ICU rounding habits. I would recommend any reader to view this editorial for a more in depth and nuanced understanding of mechanical ventilation. (1)
As you have described above, one way in which to think about mechanical ventilation is in the context of the most common scenarios in which we implement it, ie: hypoxemia and hypercapnia. Understanding that for hypoxemic patients, our tools to improve physiology are by manipulating the set FiO2 and PEEP to achieve specified targets for oxyhemoglobin saturation or P/F ratios (with regard to ARDS management). It is important to note that a few studies have demonstrated that an FiO2 greater than 50-60% can be toxic and may result in an increase in reactive oxygen species, increased airway damage (tracheobronchitis), and secondary infection from impaired bactericidal action of immune cells. (2,3) For our hypercapnic patients, knowing their prior baseline PCO2 is helpful in determining how to adjust the respiratory rate and tidal volume to appropriately improve their respiratory acidosis.
An important common 3 part methodology to better appreciate modes of mechanical ventilation is understanding the “trigger”, “target”, and “cycle” of each ventilator mode. In the simplest of terms, the “trigger” is what prompts the ventilator to deliver the breath (ie: an assisted breath when the ventilator senses a patient generated decrease in flow/pressure or a control breath when enough time has elapsed as mandated by the set respiratory rate). The “target” is what the ventilator aims to achieve with each breath (in the mode of AC-VC: a targeted flow rate [often ~60 L/min] or in the mode of AC-PC: a targeted inspiratory pressure [often ~15 cwp]). Finally, the “cycle” is a term that describes how the ventilator recognizes when it is time to terminate the breath that is delivered (in the mode of AC-VC: cycling off after the goal TV is reached [~600cc] or in the mode of AC-PC: cycling off after the set inspiratory time has occurred [~ 0.7 seconds]). See table below for a quick summary.
Finally, the best practical way to simplify mechanical ventilation is to request the changes by the respiratory therapist and see the effects. I encourage you to interpret all VBGs and ABGs, approach your respiratory therapist, pulmonary/CCM fellow, and suggest everything from initial ventilator settings, changes to both modes and individual parameter settings, and see the reflection of this work in your subsequent blood gases.

References
1. Walter JM, Corbridge TC, Singer BD. Invasive Mechanical Ventilation. South Med J. 2018 Dec;111(12):746-753. doi: 10.14423/SMJ.0000000000000905. PMID: 30512128; PMCID: PMC6284234.
2. Suttorp N, Simon LM. Decreased bactericidal function and impaired respiratory burst in lung macrophages after sustained in vitro hyperoxia. Am Rev Respir Dis. 1983 Sep;128(3):486-90. doi: 10.1164/arrd.1983.128.3.486. PMID: 6311064.
3. Griffith DE, Garcia JG, James HL, Callahan KS, Iriana S, Holiday D. Hyperoxic exposure in humans. Effects of 50 percent oxygen on alveolar macrophage leukotriene B4 synthesis. Chest. 1992 Feb;101(2):392-7. doi: 10.1378/chest.101.2.392. PMID: 1310457.

Ruben Mylvaganam, MD
Instructor of Medicine
Department of Pulmonology & Critical Care Medicine
Northwestern Memorial Hospital
How To Cite This Post:
[Peer-Reviewed, Web Publication] Luo, S. Stark, S. (2021, Nov 1). Mechanical Ventilation Oversimplified. [NUEM Blog. Expert Commentary by Mylvaganam, R]. Retrieved from http://www.nuemblog.com/blog/mechanical-ventilation-tips
Other Posts You May Enjoy


SonoPro Tips and Tricks for Pulmonary Embolism

Written by: Megan Chenworth, MD (NUEM ‘24) Edited by: Abiye Ibiebele, MD (NUEM ‘21) Expert Commentary by: John Bailitz, MD & Shawn Luo, MD (NUEM ‘22)
SonoPro Tips and Tricks
Welcome to the NUEM Sono Pro Tips and Tricks Series where Sono Experts team up to take you scanning from good to great for a problem or procedure! For those new to the probe, we recommend first reviewing the basics in the incredible FOAMed Introduction to Bedside Ultrasound Book and 5 Minute Sono. Once you’ve got the basics beat, then read on to learn how to start scanning like a Pro!
Did you know that focused transthoracic cardiac ultrasound (FOCUS) can help identify PE in tachycardic or hypotensive patients? (It has been shown to have a sensitivity of 92% for PE in patients with an HR>100 or SBP<90, and approaches 100% sensitivity in patients with an HR>110 [1]). Have a hemodynamically stable patient with PE and wondering how to risk stratify? FOCUS can identify right heart strain better than biomarkers or CT [2].
Who to FOCUS on?
Patients presenting with chest pain or dyspnea without a clear explanation, or with a clinical concern for PE. The classic scenario is a patient with pleuritic chest pain with VTE risk factors such as recent travel or surgery, systemic hormones, unilateral leg swelling, personal or family history of blood clots, or known hypercoagulable state (cancer, pregnancy, rheumatologic conditions).
Patients presenting with unexplained tachycardia or dyspnea with VTE risk factors
Unstable patients with undifferentiated shock
When PE is suspected but CT is not feasible: such as when the patient is too hemodynamically unstable to be moved to the scanner, too morbidly obese to fit on the scanner, or in resource-limited settings where scanners aren’t available
One may argue AKI would be another example of when CT is not feasible (though there is some debate over the risk of true contrast nephropathy - that is a discussion for another blog post!)
How to scan like a Pro
Key is to have the patient as supine as possible - this may be difficult in truly dyspneic patients
If difficulty obtaining views arise, the left lateral decubitus position helps bring the heart closer to the chest wall
FOCUS on these findings
You only need one to indicate the presence of right heart strain (RHS).
Right ventricular dilation
Septal flattening: Highly specific for PE (93%) in patients with tachycardia (HR>100) or hypotension (SBP<90) [1]
Tricuspid valve regurgitation
McConnell’s sign
Definition: Akinesis of mid free wall and hypercontractility of apical wall (example below)
The most specific component of FOCUS: 99% specific for patients with HR>100bpm or SBP<90 [1]
Tricuspid annular plane systolic excursion (TAPSE)
The most sensitive single component of FOCUS: TASPE < 2cm is 88% sensitive for PE in tachycardic and hypotensive patients; 93% sensitive when HR > 110 [1]
Where to FOCUS
Apical 4 Chamber (A4C) view: your best shot at seeing it all
Find the A4C view in the 5th intercostal space in the midclavicular line
Optimize your image by sliding up or down rib spaces, sliding more lateral towards the anterior axillary line until you see the apex with the classic 4 chambers - if the TV and MV are out of the plane, rotate the probe until you can see both openings in the same image; if the apex is not in the middle of the screen, slide the probe until the apex is in the middle of the screen. If you are having difficulty with this view, position the patient in the left lateral decubitus.
Important findings:
RV dilation: the normal RV: LV ratio in diastole is 0.6:1. If the RV > LV, it is abnormal. (see in the image below)
Septal flattening/bowing is best seen in this view
McConnell’s sign: akinesis of the free wall with preserved apical contractility
McConnell’s Sign showing akinesis of the free wall with preserved apical contractility
4. Tricuspid regurgitation can be seen with color flow doppler when positioned over the tricuspid valve
Tricuspid regurgitation seen with color doppler flow
5. TAPSE
Only quantitative measurement in FOCUS, making it the least user-dependent measurement of right heart strain [3]
A quantitative measure of how well the RV is squeezing. RV squeeze normally causes the tricuspid annulus to move towards the apex.
Fan to bring the RV as close to the center of the screen as possible
Using M-mode, position the cursor over the lateral tricuspid annulus (as below)
Activate M-mode, obtaining an image as below
Measure from peak to trough of the tracing of the lateral tricuspid annulus
Normal >2cm

How to measure TAPSE using ultrasound
Parasternal long axis (PSLA) view - a good second option if you can’t get A4C
Find the PSLA view in the 4th intercostal space along the sternal border
Optimize your image by sliding up, down, or move laterally through a rib space, by rocking your probe towards or away from the sternum, and by rotating your probe to get all aspects of the anatomy in the plane. The aortic valve and mitral valve should be in plane with each other.
Important findings:
RV dilation: the RV should be roughly the same size as the aorta and LA in this view with a 1:1:1 ratio. If RV>Ao/LA, this indicates RHS.
Septal flattening/bowing of the septum into the LV (though more likely seen in PSSA or A4C views)

Right heart strain demonstrated by right ventricle dilation
Parasternal Short Axis (PSSA) view: the second half of PSLA
Starting in the PSLA view, rotate your probe clockwise by 90 degrees to get PSSA
Optimize your image by fanning through the heart to find the papillary muscles - both papillary muscles should be in-plane - if they are not, rotate your probe to bring them both into view at the same time
Important findings:
Septal flattening/bowing: in PSSA, it is called the “D-sign”.

“D-sign” seen on parasternal short axis view. The LV looks like a “D” in this view, particularly in diastole.
Subxiphoid view: can add extra info to the FOCUS
Start just below the xiphoid process, pointing the probe up and towards the patient’s left shoulder
Optimize your image by sliding towards the patient’s right, using the liver as an echogenic window; rotate your probe so both MV and TV are in view in the same image
Important findings
Can see plethoric IVC if you fan down to IVC from RA (not part of FOCUS; it is sensitive but not specific to PE)

Plethoric IVC that is sensitive to PE
What to do next?
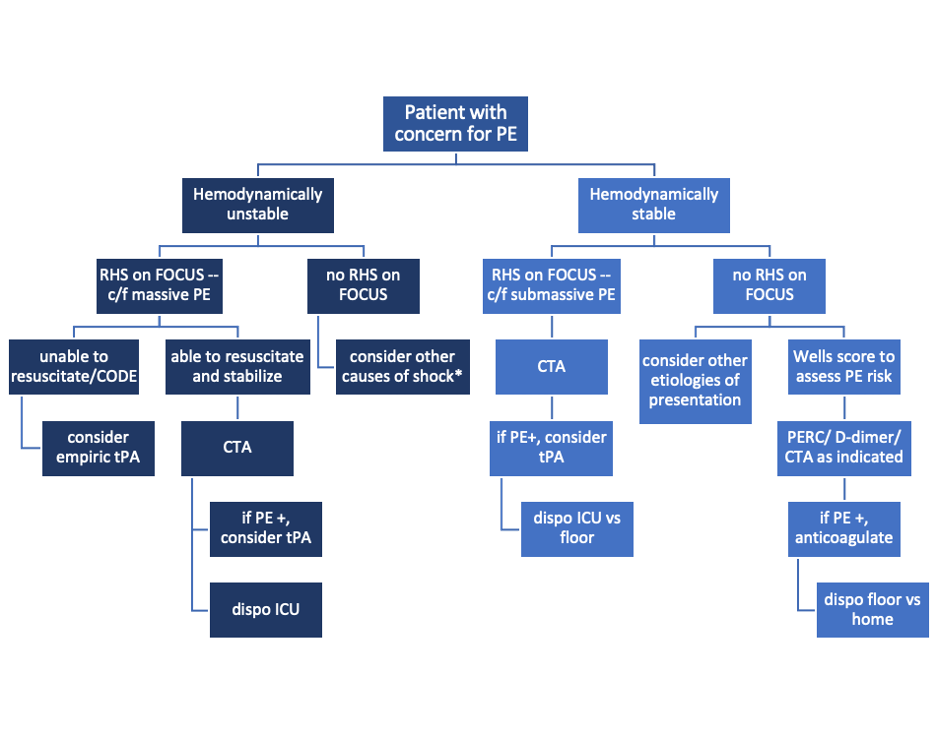
Sample algorithm for using FOCUS to assess patients with possible PE.
*cannot completely rule out PE, but negative FOCUS makes PE less likely
Limitations to keep in mind:
FOCUS is great at finding heart strain, but the lack of right heart strain does not rule out a pulmonary embolism
Systematic review and meta-analysis concluded that the overall sensitivity of FOCUS for PE is 53% (95% CI 45-61%) for all-comers [5]
Total FOCUS exam requires adequate PSLA, PSSA, and A4C views – be careful when interpreting inadequate scans
Can see similar findings in chronic RHS (pHTN, RHF)
Global thickening of RV (>5mm) can help distinguish chronic from acute RHS
McConell’’s sign is also highly specific for acute RHS, whereas chronic RV failure typically appears globally akinetic/hypokinetic

SonoPro Tips - Where to Learn More
Right Heart Strain at 5-Minute Sono: http://5minsono.com/rhs/
Ultrasound GEL for Sono Evidence: https://www.ultrasoundgel.org/posts/EJHu_SYvE4oBT4igNHGBrg, https://www.ultrasoundgel.org/posts/OOWIk1H2dePzf_behpaf-Q
The Pocus Atlas for real examples: https://www.thepocusatlas.com/echocardiography-2
The Evidence Atlas for Sono Evidence: https://www.thepocusatlas.com/ea-echo
References
Daley JI, Dwyer KH, Grunwald Z, Shaw DL, Stone MB, Schick A, Vrablik M, Kennedy Hall M, Hall J, Liteplo AS, Haney RM, Hun N, Liu R, Moore CL. Increased Sensitivity of Focused Cardiac Ultrasound for Pulmonary Embolism in Emergency Department Patients With Abnormal Vital Signs. Acad Emerg Med. 2019 Nov;26(11):1211-1220. doi: 10.1111/acem.13774. Epub 2019 Sep 27. PMID: 31562679.
Weekes AJ, Thacker G, Troha D, Johnson AK, Chanler-Berat J, Norton HJ, Runyon M. Diagnostic Accuracy of Right Ventricular Dysfunction Markers in Normotensive Emergency Department Patients With Acute Pulmonary Embolism. Ann Emerg Med. 2016 Sep;68(3):277-91. doi: 10.1016/j.annemergmed.2016.01.027. Epub 2016 Mar 11. PMID: 26973178.
Kopecna D, Briongos S, Castillo H, Moreno C, Recio M, Navas P, Lobo JL, Alonso-Gomez A, Obieta-Fresnedo I, Fernández-Golfin C, Zamorano JL, Jiménez D; PROTECT investigators. Interobserver reliability of echocardiography for prognostication of normotensive patients with pulmonary embolism. Cardiovasc Ultrasound. 2014 Aug 4;12:29. doi: 10.1186/1476-7120-12-29. PMID: 25092465; PMCID: PMC4126908.
Hugues T, Gibelin PP. Assessment of right ventricular function using echocardiographic speckle tracking of the tricuspid annular motion: comparison with cardiac magnetic resonance. Echocardiography. 2012 Mar;29(3):375; author reply 376. doi: 10.1111/j.1540-8175.2011.01625_1.x. PMID: 22432648.
Fields JM, Davis J, Girson L, et al. Transthoracic echocardiography for diagnosing pulmonary embolism: a systematic review and meta‐analysis. J Am Soc Echocardiogr 2017;30:714–23.e4.
Expert Commentary
RV function is a frequently overlooked area on POCUS. Excellent post by Megan looking specifically at RV to identify hemodynamically significant PEs. We typically center our image around the LV, so pay particular attention to adjust your views so the RV is optimized. This may mean moving the footprint more laterally and angle more to the patient’s right on the A4C view. RV: LV ratio is often the first thing you will notice. When looking for a D-ring sign, make sure your PSSA is actually in the true short axis, as a diagonal cross-section may give you a false D-ring sign. TAPSE is a great surrogate for RV systolic function as RV contracts longitudinally. Many patients with pulmonary HTN or advanced chronic lung disease can have chronic RV failure, lack of global RV thickening. Lastly remember, that a positive McConnell’s sign is a great way to distinguish acute RHS from chronic RV failure.

John Bailitz, MD
Vice Chair for Academics, Department of Emergency Medicine
Professor of Emergency Medicine, Feinberg School of Medicine
Northwestern Memorial Hospital

Shawn Luo, MD
PGY4 Resident Physician
Northwestern University Emergency Medicine
How To Cite This Post:
[Peer-Reviewed, Web Publication] Chenworth, M. Ibiebele, A. (2021 Oct 4). SonoPro Tips and Tricks for Pulmonary Embolism. [NUEM Blog. Expert Commentary by Bailitz, J. Shawn, L.]. Retrieved from http://www.nuemblog.com/blog/sonopro-tips-and-tricks-for-pulmonary-embolism
Other Posts You May Enjoy


Basic Capnography Interpretation

Written by: Shawn Luo, MD (NUEM ‘22) Edited by: Matt McCauley, MD (NUEM ‘21) Expert Commentary by: N. Seth Trueger, MD, MPH
Continuous waveform capnography has increasingly become the gold standard of ETT placement confirmation. However, capnography can provide additional valuable information, especially when managing critically ill or mechanically ventilated patients.
Normal Capnography
Phase I (inspiratory baseline) reflects inspired air, which is normally devoid of CO2.
Phase II (expiratory upstroke) is the transition between dead space to alveolar gas.
Phase III is the alveolar plateau. Traditionally, PCO2 of the last alveolar gas sampled at the airway opening is called the EtCO2. (normally 35-45 mmHg)
Phase 0 is the inspiratory downstroke, the beginning of the next inspiration

Figure 1. Normal Capnography Tracing (emDOCs.net)
EtCO2 is only one component of capnography. Measured at the end-peak of each waveform, it reflects alveolar CO2 content and is affected by alveolar ventilation, pulmonary perfusion, and CO2 production.

Figure 2. Factors affecting ETCO2 (EMSWorld)
EtCO2 - PaCO2 Correlation
Correlating EtCO2 and PaCO2 can be problematic, but in general, PaCO2 is almost always HIGHER than EtCO2. Normally the difference should be 2-5mmHg but the PaCO2-EtCO2 gradient is often increased due to increased alveolar dead space (high V/Q ratio), such as low cardiac output, cardiac arrest, pulmonary embolism, high PEEP ventilation.
Important Patterns
Let’s go through a few cases and learn some of the important capnography waveforms to recognize
Case 1: Capnography with Advanced Airway
An elderly gentleman with a history of COPD, CAD & CKD gets rushed into the trauma bay with respiratory distress and altered mental status. You gave him a trial of BiPAP for a few minutes without improvement.
You swiftly tubed the patient. It was not the easiest view, but you advance the ETT hoping for the best. Upon attaching the BVM to bag the patient, you saw this on capnography:

Figure 3. Case 1 (EMSWorld)
Oops, the ETT is in the esophagus, as evidenced by the low-level EtCO2 that quickly tapers off.
2. You remove the ETT, bag the patient up, and try again with a bougie. Afterward, you see…

Figure 4. Capnography with ETT in right main bronchus (EMSWorld)
This suggests a problem with ETT position, most often in the right main bronchus. Notice the irregular plateau--the initial right lung ventilation, followed by CO2 escaping from the left lung. Beware that capnography can sometimes still appear normal despite the right main bronchus placement.
3. You pull back the ETT a few cm and the CXR now confirms the tip is now above the carina. The patient’s capnography now looks like this:

Figure 5. Capnography showing obstruction or bronchospasm (SketchyMedicine)
Almost looks normal but notice the “shark fin” appearance, this is due to delayed exhalation, often seen in airway obstruction and bronchospasms such as COPD or asthma exacerbation.
4. You suction the patient and administer several bronchodilator nebs. The waveform now looks more normal:

Figure 6. Capnography showing normal waveform (SketchyMedicine)
5. However, just as you were about to get back to the workstation to call the ICU, the monitor alarms and you see this:

Figure 7. Sudden loss of capnography waveform (SketchyMedical)
Noticing the ETT still in place with good chest rise, you quickly check for a pulse. There is none.
6. You holler, push the code button and start ACLS with a team of clinicians. With CPR in progress, you notice this capnography:

Figure 8. Capnography during CPR (SketchyMedicine)
Initially, your patient’s EtCO2 was only 7, after coaching the compressor and improving CPR techniques, it increased to 14.
You are also aware that EtCO2 at 20min of CPR has prognostic values. EtCO2 <10 mmHg at 20 minutes suggests little chance of achieving ROSC and can be used as an adjunctive data point in the decision to terminate resuscitation.
7. Fortunate for your patient, during the 3rd round of ACLS, you notice the following:

Figure 9. ROSC on capnography (emDOCs.net)
This sudden jump in EtCO2 suggests ROSC. You stop the CPR and confirm that the patient indeed has a pulse.
8. As you are putting in orders for post-resuscitation care, you notice this:

Figure 10. Asynchronous breathing on capnography (SketchyMedical)
This curare cleft comes from the patient inhaling in between ventilator-delivered breaths and is usually a sign of asynchronous breathing. However, in the post-arrest scenario, it is a positive prognostic sign as your patient is breathing spontaneously. You excitedly call your mom, I meant MICU, about the incredible save.
Case 2: Capnography with Non-intubated Patient
You just hung up the phone with MICU when EMS brings you a young woman with a heroin overdose. She already received some intranasal Narcan from EMS but per EMS report patient is becoming sleepy again.
She mumbles a little as you shout her name, and as you put an end-tidal nasal cannula on her, you saw this:

Figure 11. Hypoventilation on capnography (emDOCs.net)
Noticing the low respiratory rate and high EtCO2 value, you recognize this is hypoventilation.
2. But very soon she becomes even less responsive and the waveform changed again:

Figure 12. Airway obstruction on capnography (emDOCs.net)
The inconsistent, interrupted breaths suggest airway obstruction, while the segments without waveform suggest apnea. You have to act fast.
3. By then your nurse has already secured an IV, so you pushed some Narcan. However, in the heat of the moment, you gave the whole syringe. The patient quickly woke up crying and shaking.

Figure 13. Hyperventilating on capnography (emDOCs.net)
She was quite upset and hyperventilating. The waveform reveals a high respiratory rate and relatively low EtCO2.
As much as you are a little embarrassed by putting the patient into florid withdrawal, you know it could have been a lot worse. Walking away from the shift, you think about how many times capnography has assisted you during those critical moments. “Hey, perhaps we should buy a capnography instead of a baby monitor,” you ask your wife at dinner.
Additional Resources
This website provides a tutorial and quiz on some of the basic capnography waveforms.
References
American Heart Association. 2019 American Heart Association Focused Update on Advanced Cardiovascular Life Support. Circulation. 2019; 140(24). https://doi.org/10.1161/CIR.0000000000000732
Brit Long. Interpreting Waveform Capnography: Pearls and Pitfalls. emDOCs.net. www.emdocs.net/interpreting-waveform-capnography-pearls-and-pitfalls/, accessed May 12, 2020
Capnography.com, accessed May 12, 2020
Kodali BS. Capnography outside the operating rooms. Anesthesiology. 2013 Jan;118(1):192-201. PMID: 23221867.
Long, Koyfman & Vivirito. Capnography in the Emergency Department: A Review of Uses, Waveforms, and Limitations. Clinical Reviews in Emergency Medicine. 2017; 53(6). https://doi.org/10.1016/j.jemermed.2017.08.026
Nassar & Schmidt, Capnography During Critical Illness. CHEST. 2016; 249(2). https://doi.org/10.1378/chest.15-1369
Sketchymedicine.com/2016/08/waveform-capnography, accessed May 13, 2020
Wampler, D. A. Capnography as a Clinical Tool. EMS World. www.emsworld.com/article/10287447/capnography-clinical-tool. June 28, 2011. Accessed May 13, 2020
Expert Commentary
This is a nice review of many of the intermediate and qualitative uses of ETCO2 in the ED. For novices, I recommend a few basic places to start:
Confirmation of intubation. Color change is good but it’s just litmus paper and gets easily defeated by vomit. Also, in low output states, it may not pick up. Further, colorimetric capnographs require persistent change over 6 breaths, not just a single change. Waveform capnography uses mass spec or IR spec to detect CO2 molecules. There are so many uses, it’s good to have, I don’t see why some are resistant to use this better plastic adapter connected to the monitor vs the other, worse, plastic adapter.
a. The mistake I have seen here is assuming a lack of waveform is due to low cardiac output, ie there’s no waveform because the patient is being coded, not because of esophageal intubation. There is always *some* CO2 coming out if there is effective CPR; if there isn’t, the tube is in the wrong place. If you really don’t believe it, check with good VL but a flatline = esophagus.
2. Procedural sedation. There’s lots of good work and some debate about absolute or relative CO2 changes or qualitative waveform changes that might predict impending apnea, but for me, the best use is that I can just glance at the monitor for a second or two and see yes, the patient is breathing. No more staring at the chest debating whether I see chest rise, etc. It’s like supervising a junior trainee during laryngoscopy with VL: it’s anxiolysis for me.
a. Using ketamine? Chest movement or other signs of respiratory effort without ETCO2 waveform means laryngospasm. Jaw thrust, bag, succinylcholine (stop when better).
3. Cardiac arrest.
a. Quality of CPR. Higher number means more output. Can mean the compressor needs to fix their technique, or more often, is tiring out and needs a swap.
b. ROSC. There can be a big jump (eg from 15 to 40) when ROSC occurs. Very helpful.
c. Ending a code. 20 mins into a code, if it’s <10 during good CPR, the patient is unlikely to survive. I try to view this as confirming what we know – it’s time to end the code. The mistake here is to not end a code that should otherwise end because the ETCO2 is above 10; it doesn’t work like that, it’s a 1-way test.
4. Leak. One waveform shape I wanted to add that I find helpful: if the downstroke kinda dribbles down like a messy staircase, it’s a leak. Can be an incomplete connection (eg tubing to the vent) or the balloon is too empty or full.

Seth Trueger, MD, MPH
Assistant Professor of Emergency Medicine
Department of Emergency Medicine
Northwestern University
How To Cite This Post:
[Peer-Reviewed, Web Publication] Luo, S., McCauley M. (2021, Sept 9). Basic Capnography Interpretation. [NUEM Blog. Expert Commentary by Trueger N.S]. Retrieved from http://www.nuemblog.com/blog/capnography
Other Posts You May Enjoy


Inhaled TXA

Written by: Jim O’Brien, MD (NUEM ‘23) Edited by: Kevin Dyer (NUEM ‘20) Expert Commentary by: Dion Tyler, PharmD


Expert Commentary
Great job to the authors on providing a thorough description of TXA use in patients with hemoptysis. Another benefit of iTXA is that the IV TXA solution used for hemoptysis management is relatively inexpensive, ranging from $8.70-$86.80 per 100mg/mL (10 mL) vial [1].
An important consideration to note from the study conducted by Wand and colleagues is the exclusion of patients with massive hemoptysis defined as >200 mL of expectorated blood in 24 hours. As patients with massive hemoptysis may require additional emergent procedures to secure hemostasis such as bronchial artery embolization (BAE) or surgical intervention, a gap in knowledge exists whether TXA would be as effective in these patients as monotherapy or as an adjunct to the interventional therapies mentioned above [2,3].
An additional observational study has been recently published evaluating the use of iTXA for pulmonary hemorrhage in 19 critically ill pediatric patients. Pulmonary hemorrhage was caused by a variety of etiologies, with the most common etiology being diffuse alveolar hemorrhage. TXA was administered via inhalation or direct endotracheal instillation using the 100 mg/mL intravenous solution over 15-20 minutes. The dosing ranged from 250-500mg every 6-24 hours, with the most common regimen utilizing 250mg/dose every 8 hours. The study found that 18/19 (95%) of the patients demonstrated improvements in hemoptysis after the first dose of TXA and achieved cessation of pulmonary hemorrhage within 48 hours of iTXA administration. The only patient who did not have cessation of pulmonary hemorrhage was a patient on ECMO receiving systemic anticoagulation with unfractionated heparin. The median days of bleeding after TXA was initiated, days of TXA therapy received, total doses of TXA received, and cumulative dose of TXA received were 1 day, 3 days, 7 doses, and 2,500mg, respectively. Patients also received significantly less blood product transfusions after receiving iTXA (480 vs. 29.5 mL/kg; p=0.034). The study compared survivors with nonsurvivors but did not note any significant differences in the above outcomes between the two groups. There were no major adverse effects of iTXA or instances of bronchospasm reported in this study, and iTXA did not affect ventilatory settings for mechanically-ventilated patients. This study was limited by its retrospective design and lack of control group [4].
iTXA appears to be a safe, effective, and inexpensive intervention for management of hemoptysis. Additional research is required to determine optimal dosing and delivery approaches, as well as evaluate its safety and efficacy in patients with massive hemoptysis who may require additional emergent interventions and individuals receiving systemic anticoagulation or antiplatelet therapies.
References
Tranexamic acid. Lexi-Drugs. Hudson, OH: Lexicomp, 2020. http://online.lexi.com/. Accessed July 26, 2020.
Wand O, Guber E, Guber A, et al. Inhaled tranexamic acid for hemoptysis treatment: A randomized controlled trial. Chest. 2018; 154:1379–1384.
Davidson K, Shojaee S. Managing massive hemoptysis. Chest. 2020;157(1):77-88.
O’Neil ER, Schmees LR, Resendiz K, et al. Inhaled tranexamic acid as a novel treatment for pulmonary hemorrhage in critically ill pediatric patients: an observational study. Critical Care Explorations. 2020;2(1):e0075.

Dion Tyler, PharmD
Emergency Medicine Pharmacy Specialist
Sinai Health System
Chicago, IL
How To Cite This Post:
[Peer-Reviewed, Web Publication] O’Brien, J. Dyer, K. (2020, Dec 21). Inhaled TXA. [NUEM Blog. Expert Commentary by Tyler, D]. Retrieved from http://www.nuemblog.com/blog/iTXA.
Other Posts You May Enjoy
Altitude Illness

Written by: Alex Herndon, MD (NUEM ‘21) Edited by: Danielle Miller, MD (NUEM ‘19) Expert Commentary by: Gabrielle Ahlzadeh, MD

Expert Commentary
During my four years of residency at sea level, I never treated a patient with altitude sickness. Now, living in Utah and working at a ski clinic where the peak is just over 11,000 feet, I see it almost weekly. Patients tend to be surprised when we diagnose them with acute mountain sickness, either because they are physically fit, otherwise healthy or have been to altitude before and never had symptoms. Educating patients that altitude sickness can affect anyone, regardless of how many marathons they’ve run, is important in ensuring that they follow directions to manage their symptoms. A lot of patients also don’t realize that it takes a few days to develop altitude sickness, and that days 2-3 are usually when symptoms develop. Oftentimes, not sleeping well may be the first symptom. If patients present with symptoms of poor sleep and headaches, it’s important to instruct patients to take it easy and take time to adjust, as well as the importance of staying hydrated and doing their best to get enough sleep. It’s helpful to frame this as days lost on the mountain so patients take their mild symptoms seriously.
Anecdotally, most patients improve pretty rapidly with oxygen administration so when any patient from out of town presents with vague symptoms, our first step in ski clinic is to put them on oxygen . Some patients look pale and ill while others don’t even look sick, and you’re often shocked by their low oxygen saturation. We’ve had fit young patients with oxygen saturations in the 70s who look completely fine, which again, just stresses the importance of obtaining vitals and not being fooled by healthy and fit patients. I’ve seen kids who present with fatigue, vomiting and headache who look sick and then after an hour of oxygen and some fluids, bounce right back to their normal selves.
Obviously it’s important to maintain a broad differential for patients who present with symptoms of altitude sickness, while recognizing that it is a diagnosis that can tie together multiple symptoms. This is especially true in pediatric patients who cannot articulate their symptoms clearly. Checking an initial blood sugar is part of our initial workup, especially in kids. But, if you don’t consider acute mountain sickness, then you won’t be able to make your patient feel better with oxygen, descent or other medications.
From the ski clinic, we often send patients home with portable oxygen tanks mainly to use while they are sleeping, since poor sleep often makes symptoms worse. We treat most patients with both acetazolamide and dexamethasone and frequently recommend they come back to clinic the next day for reassessment. We often recommend that patients sleep at lower altitude and just come up for skiing if possible. For patients with evidence of pulmonary edema, they must descend and are sent to the ER for closer monitoring and treatment. The same would be true with any patient with evidence of altered mental status.

Gabrielle Ahlzadeh, MD
Clinical Assistant Professor of Emergency Medicine
University of Southern California
How To Cite This Post:
[Peer-Reviewed, Web Publication] Herndon, A. Miller, D. (2020, Aug 31). Altitude Illness. [NUEM Blog. Expert Commentary by Ahlzadeh, A]. Retrieved from http://www.nuemblog.com/blog/altitude-illness
Other Posts You May Enjoy


Pneumothorax Part II: Management In The ED
While spontaneous pneumothorax is a common problem encountered by emergency physicians, there remains regular controversy regarding its appropriate management. Read this weeks post to learn more.
Steroid Selection In Pediatric Asthma
Pediatric asthma exacerbations account for a significant portion of trips to the emergency department (ED), comprising 2-4.5% of ED visits each year. As a common disease of the pediatric population, effective ED management is key. The current mainstay of treatment is beta-agonist and corticosteroid administration. Here we discuss the evidence behind steroid selection in the pediatric asthmatic presenting to the emergency department.